监控与告警系统部署:
项目示例: "使用Prometheus + Grafana + node_exporter实现Linux服务器性能监控"
描述: 在目标服务器部署node_exporter采集系统指标(CPU, 内存, 磁盘, 网络)。
部署配置Prometheus Server,抓取node_exporter数据。
部署配置Grafana,连接Prometheus数据源,创建可视化仪表盘展示关键指标。 配置Prometheus Alertmanager或Grafana告警规则(如CPU使用率>90%持续5分钟邮件告警)。
技术关键词: Prometheus, Grafana, node_exporter, Alertmanager,
监控指标(CPU/Mem/Disk/Net), 告警规则。
亮点: 掌握现代监控栈的核心流程,理解关键性能指标,具备告警意识。
你将部署并掌握以下组件:
node_exporterPrometheusGrafanaAlertmanager我会按以下 5 个阶段带你完成部署,每一步我都可以给你指令+截图模板:
你至少要有:
-
🖥️ 1 台 Linux 虚拟机(推荐 CentOS 7 或 Ubuntu 20.04)
✅ 如果有 VMware + CentOS 就直接用那台
✅ 最好关掉 selinux 和 firewalld -
📶 能联网(或者提前下载好 Prometheus/Grafana 安装包)
-
📁 一个安装目录,如:
/opt/monitoring
✅ 第1阶段:部署 node_exporter(采集系统指标)
目标:你这台主机的 CPU/内存/磁盘 数据能被采集到
第1步:下载安装 node_exporter
# 进入工作目录
cd /opt

# 下载 node_exporter(以 v1.8.1 为例)

wget https://github.com/prometheus/node_exporter/releases/download/v1.8.1/node_exporter-1.8.1.linux-amd64.tar.gz

 # 解压

tar -xzf node_exporter-1.8.1.linux-amd64.tar.gz

cd node_exporter-1.8.1.linux-amd64
第2步:后台运行 node_exporter
# 启动 node_exporter(监听在 9100 端口) ,一定要先进入cd node_exporter-1.8.1.linux-amd64目录

./node_exporter &
遇到问题:
执行了
后,光标仍然闪动,好像没进入后台
可能原因:
原因一:程序其实没有完全进入后台
虽然你用了 &,但:
-
程序可能打印了很多日志到控制台(stdout / stderr),
-
shell 仍然认为你“在等它输出”,光标就会一直闪,
-
所以
Ctrl + C终止了它。
这是 Linux 的常见行为,并不是命令错了。
原因二:程序被调度到后台了,但还有“子线程/子进程”输出信息或没释放终端控制权。
解决办法
用 nohup 让它真正脱离终端运行(临时使用)
cd到这个/usr/local/Prometheusm目录下执行
nohup ./node_exporter > /dev/null 2>&1 &
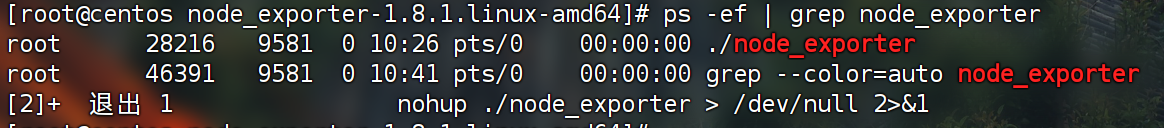
第3步:确认是否运行成功
# 查看监听端口
netstat -tunlp | grep 9100
# 浏览器访问

 http://主机号:9100/metrics
#或者
 ps -ef | grep node_exporter
1. 下载并解压 Prometheus
你可以从 官网 获取,也可以直接用以下命令下载最新版:
cd /usr/local/src/

wget https://github.com/prometheus/prometheus/releases/download/v2.52.0/prometheus-2.52.0.linux-amd64.tar.gz

tar -xzf prometheus-2.52.0.linux-amd64.tar.gz

mv prometheus-2.52.0.linux-amd64 /usr/local/Prometheus

cd /usr/local/Prometheus
2. 编辑配置文件 prometheus.yml
vim prometheus.yml
在 scrape_configs 下添加 node_exporter 的配置,例如:
scrape_configs:
  - job_name: 'node_exporter'
    static_configs:
      - targets: ['localhost:9100']
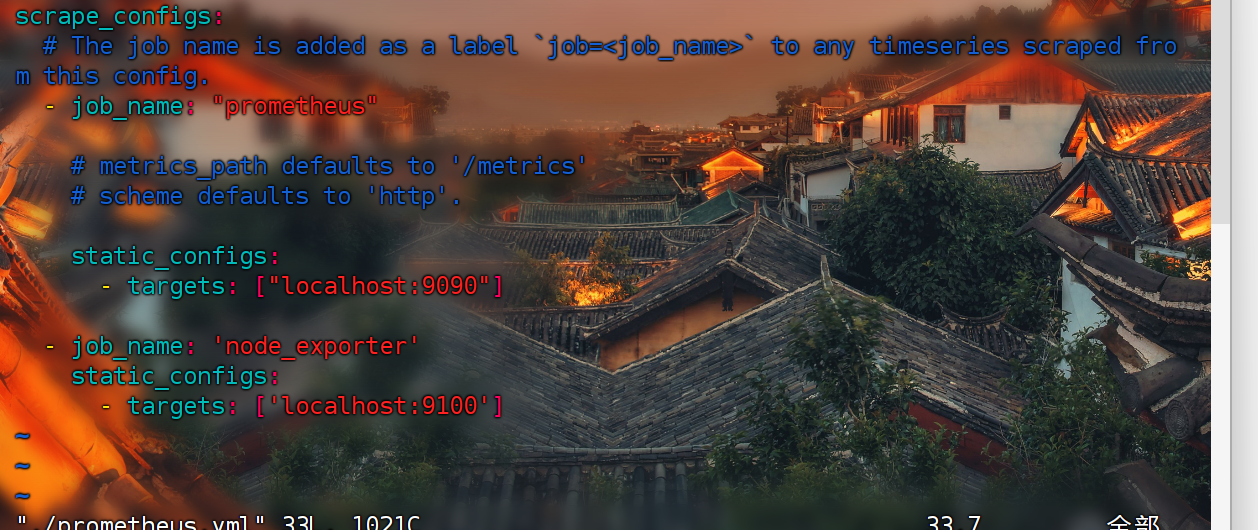
🔍 说明:
localhost:9100是你的node_exporter默认监听地址。如果你的
node_exporter是部署在别的服务器上,则改为对应的 IP,例如:192.168.1.100:9100
3. 启动 Prometheus
./prometheus --config.file=prometheus.yml &
-
启动后访问 Prometheus Web UI:
http://<你的服务器IP>:9090
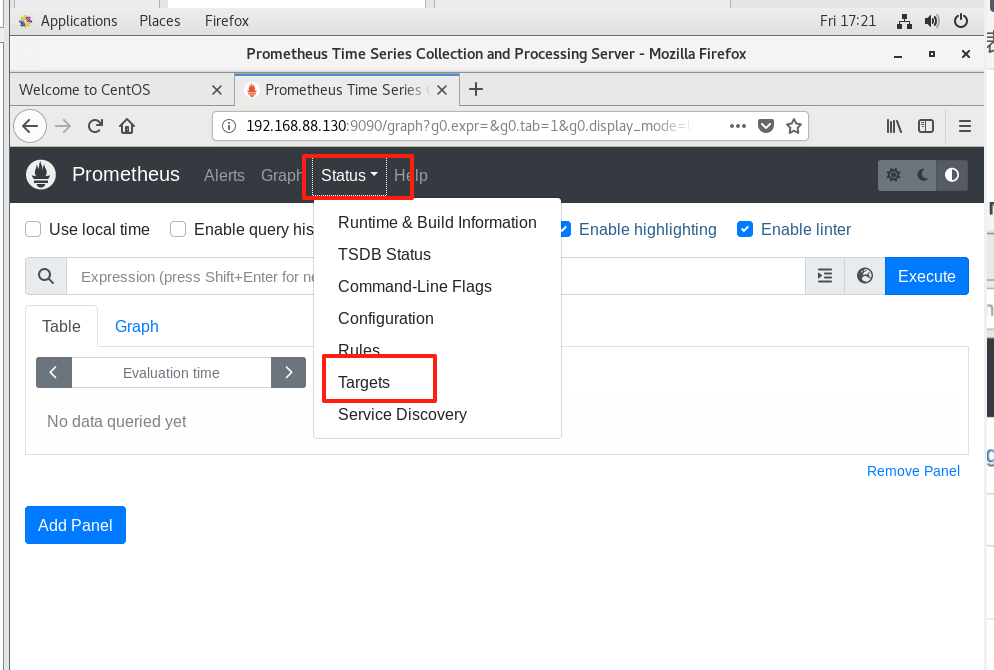
4. 验证是否采集到 node_exporter 数据
在浏览器中打开 http://<你的服务器IP>:9090
-
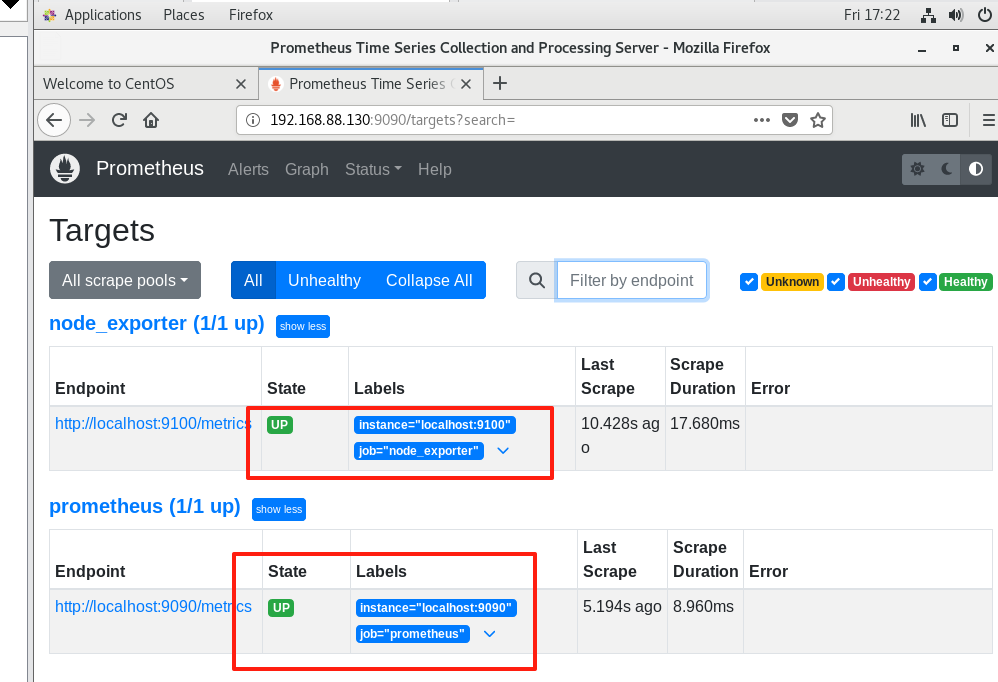
点击 “Status” → “Targets”
-
查看是否有
node_exporter的目标出现,并且状态为 UP
图示:
✅ 当前进度回顾
Grafana 是一个强大的开源可视化工具,用于展示 Prometheus 收集的数据。
1. 安装 Grafana
方法一:使用 RPM 包安装(推荐 CentOS)
# 添加 Grafana 官方源
cat <<EOF | sudo tee /etc/yum.repos.d/grafana.repo
[grafana]
name=grafana
baseurl=https://packages.grafana.com/oss/rpm
repo_gpgcheck=1
enabled=1
gpgcheck=1
gpgkey=https://packages.grafana.com/gpg.key
EOF

# 安装 Grafana
sudo yum install -y grafana
2. 启动 Grafana 并设置为开机启动
sudo systemctl start grafana-server

sudo systemctl enable Grafana-serverGrafana
3. 放行防火墙端口(默认 3000)
bash
复制编辑
sudo firewall-cmd --add-port=3000/tcp --permanent sudo firewall-cmd --reload
4. 访问 Grafana Web 界面
打开浏览器访问:
http://<你的服务器IP>:3000
首次登录默认账号密码是:
用户名:admin 密码:admin
首次登录会要求修改密码,请记住新密码。
5. 添加 Prometheus 数据源
登录 Grafana 后:
-
点击左侧边栏的 Data Sources
-
点击 Add data source
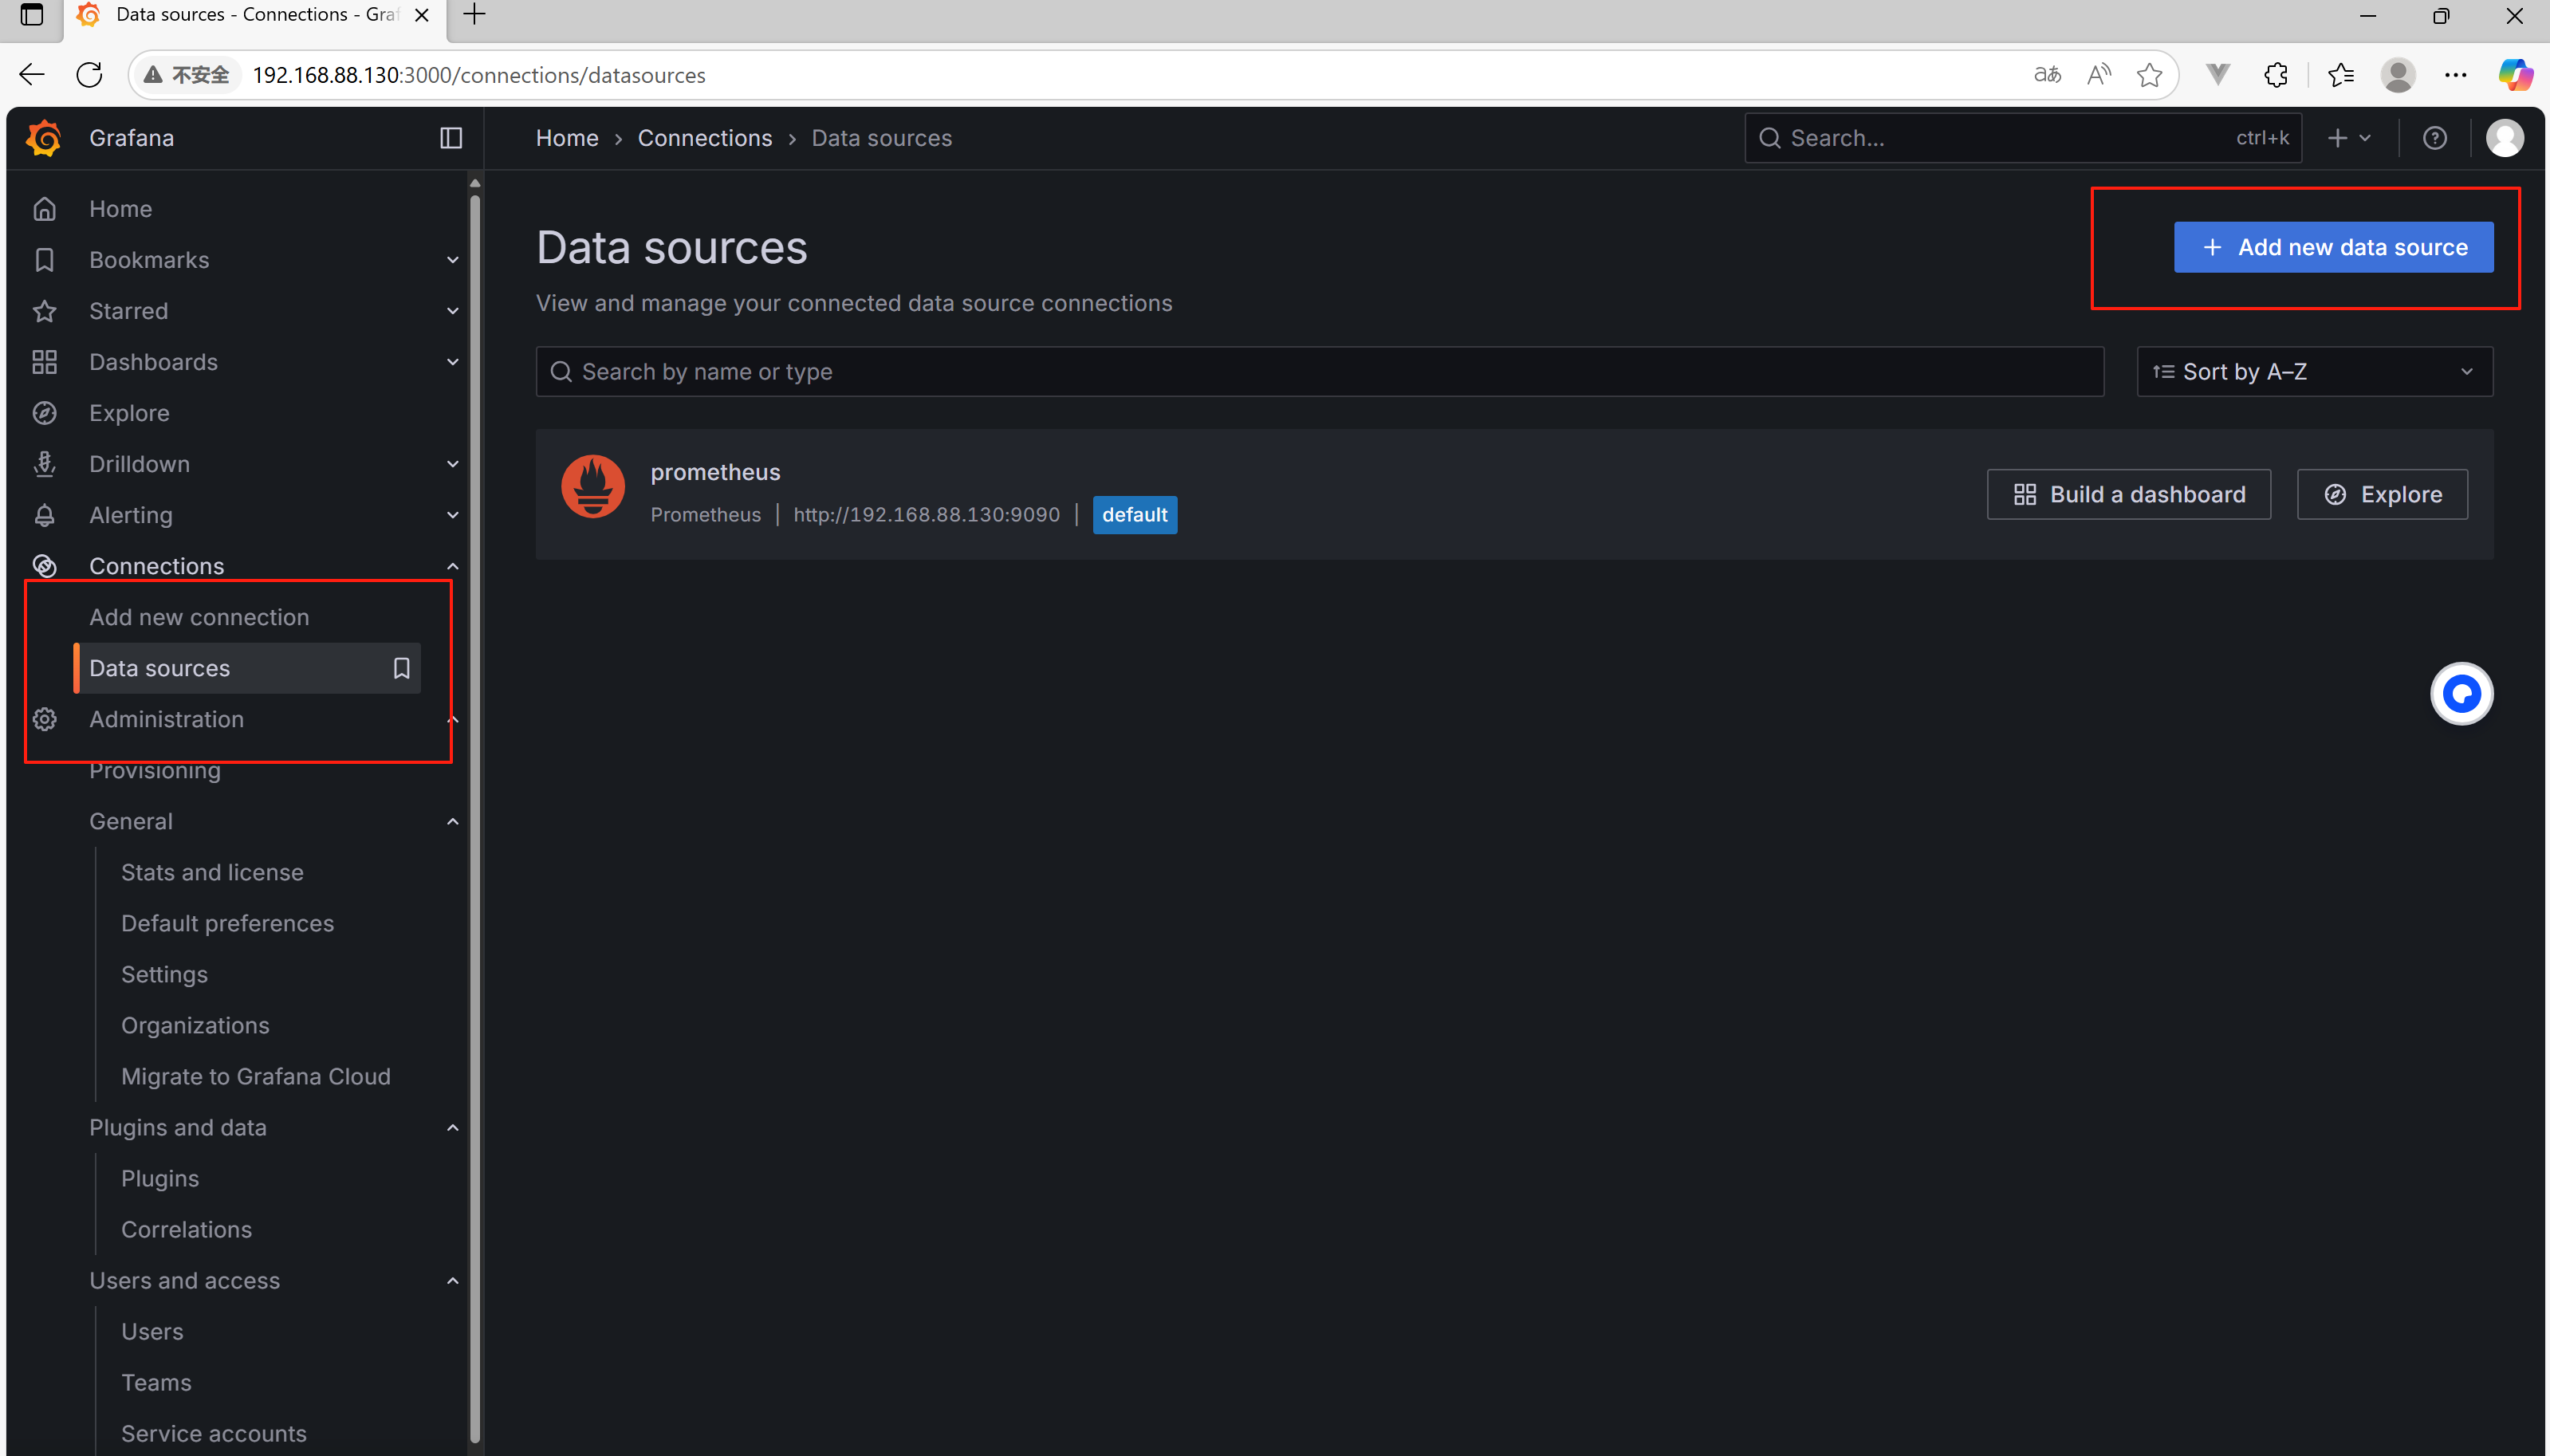
-
选择 Prometheus
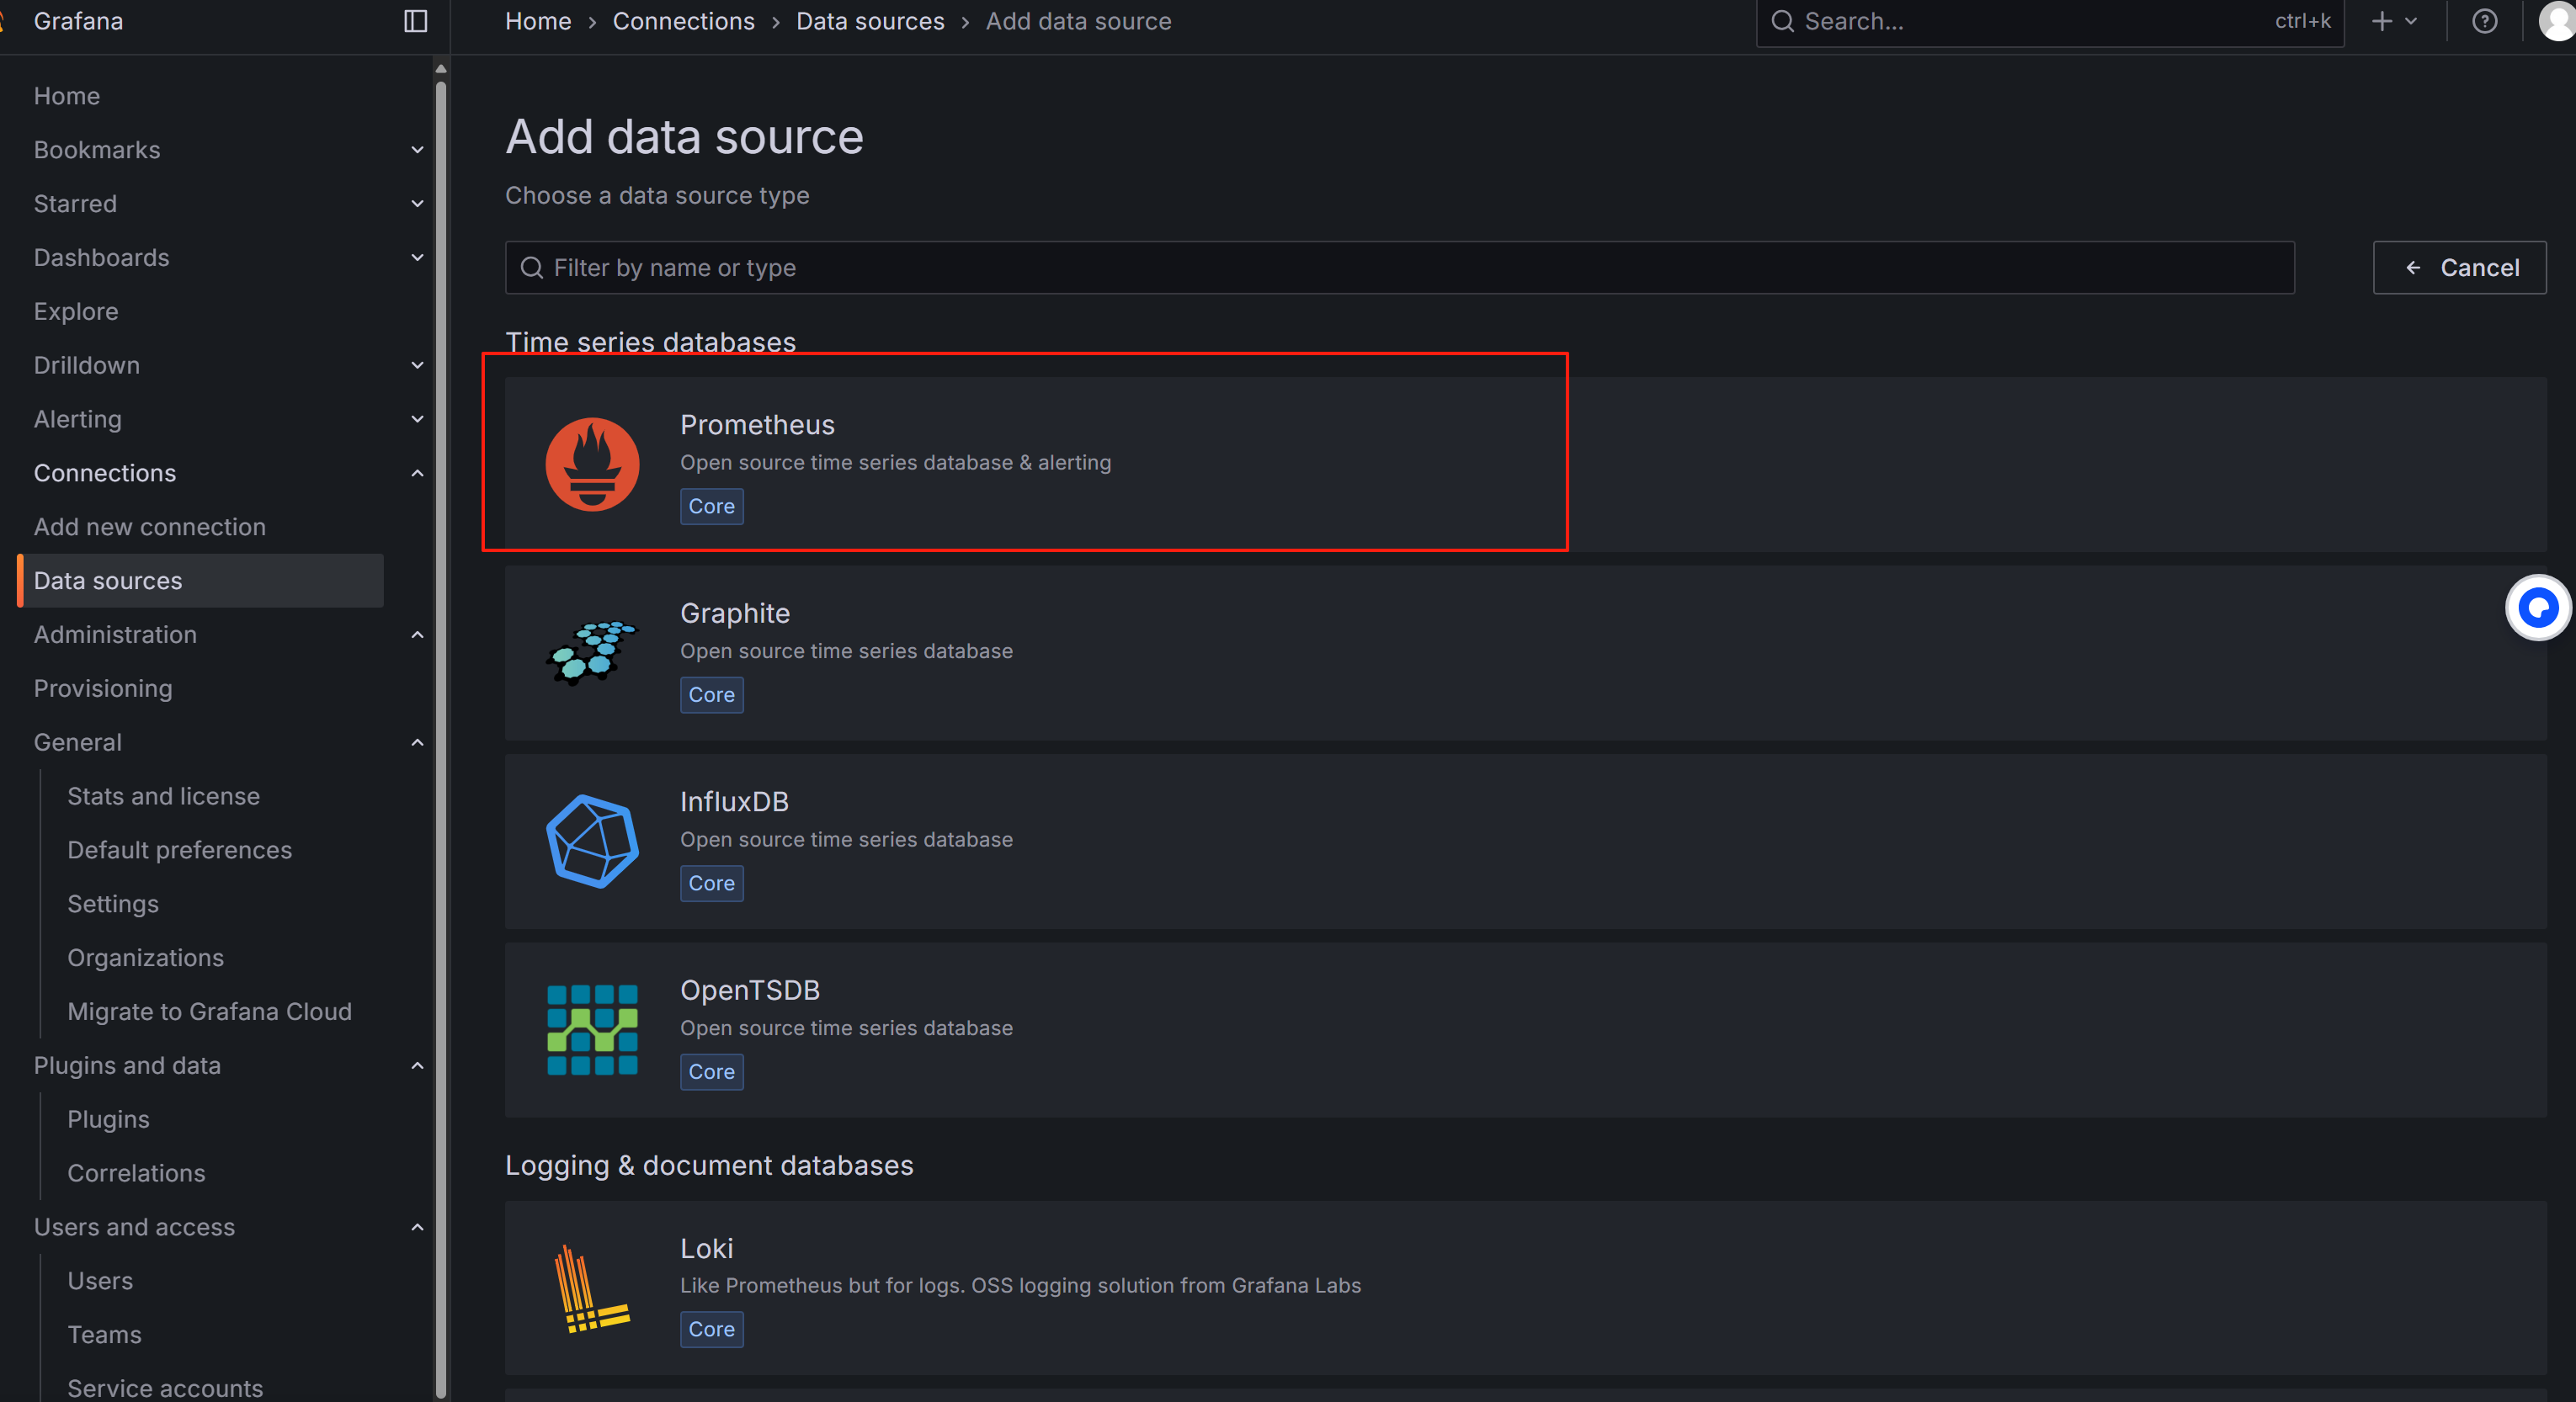
-
在 URL 填入:
http://localhost:9090 -
点击底部的 Save & Test,显示 success 即可。
6. 导入官方 Node Exporter 监控模板(Dashboard)
Grafana 社区已有 Node Exporter 的可视化模板,操作如下:
-
点击左侧 “+” → Import
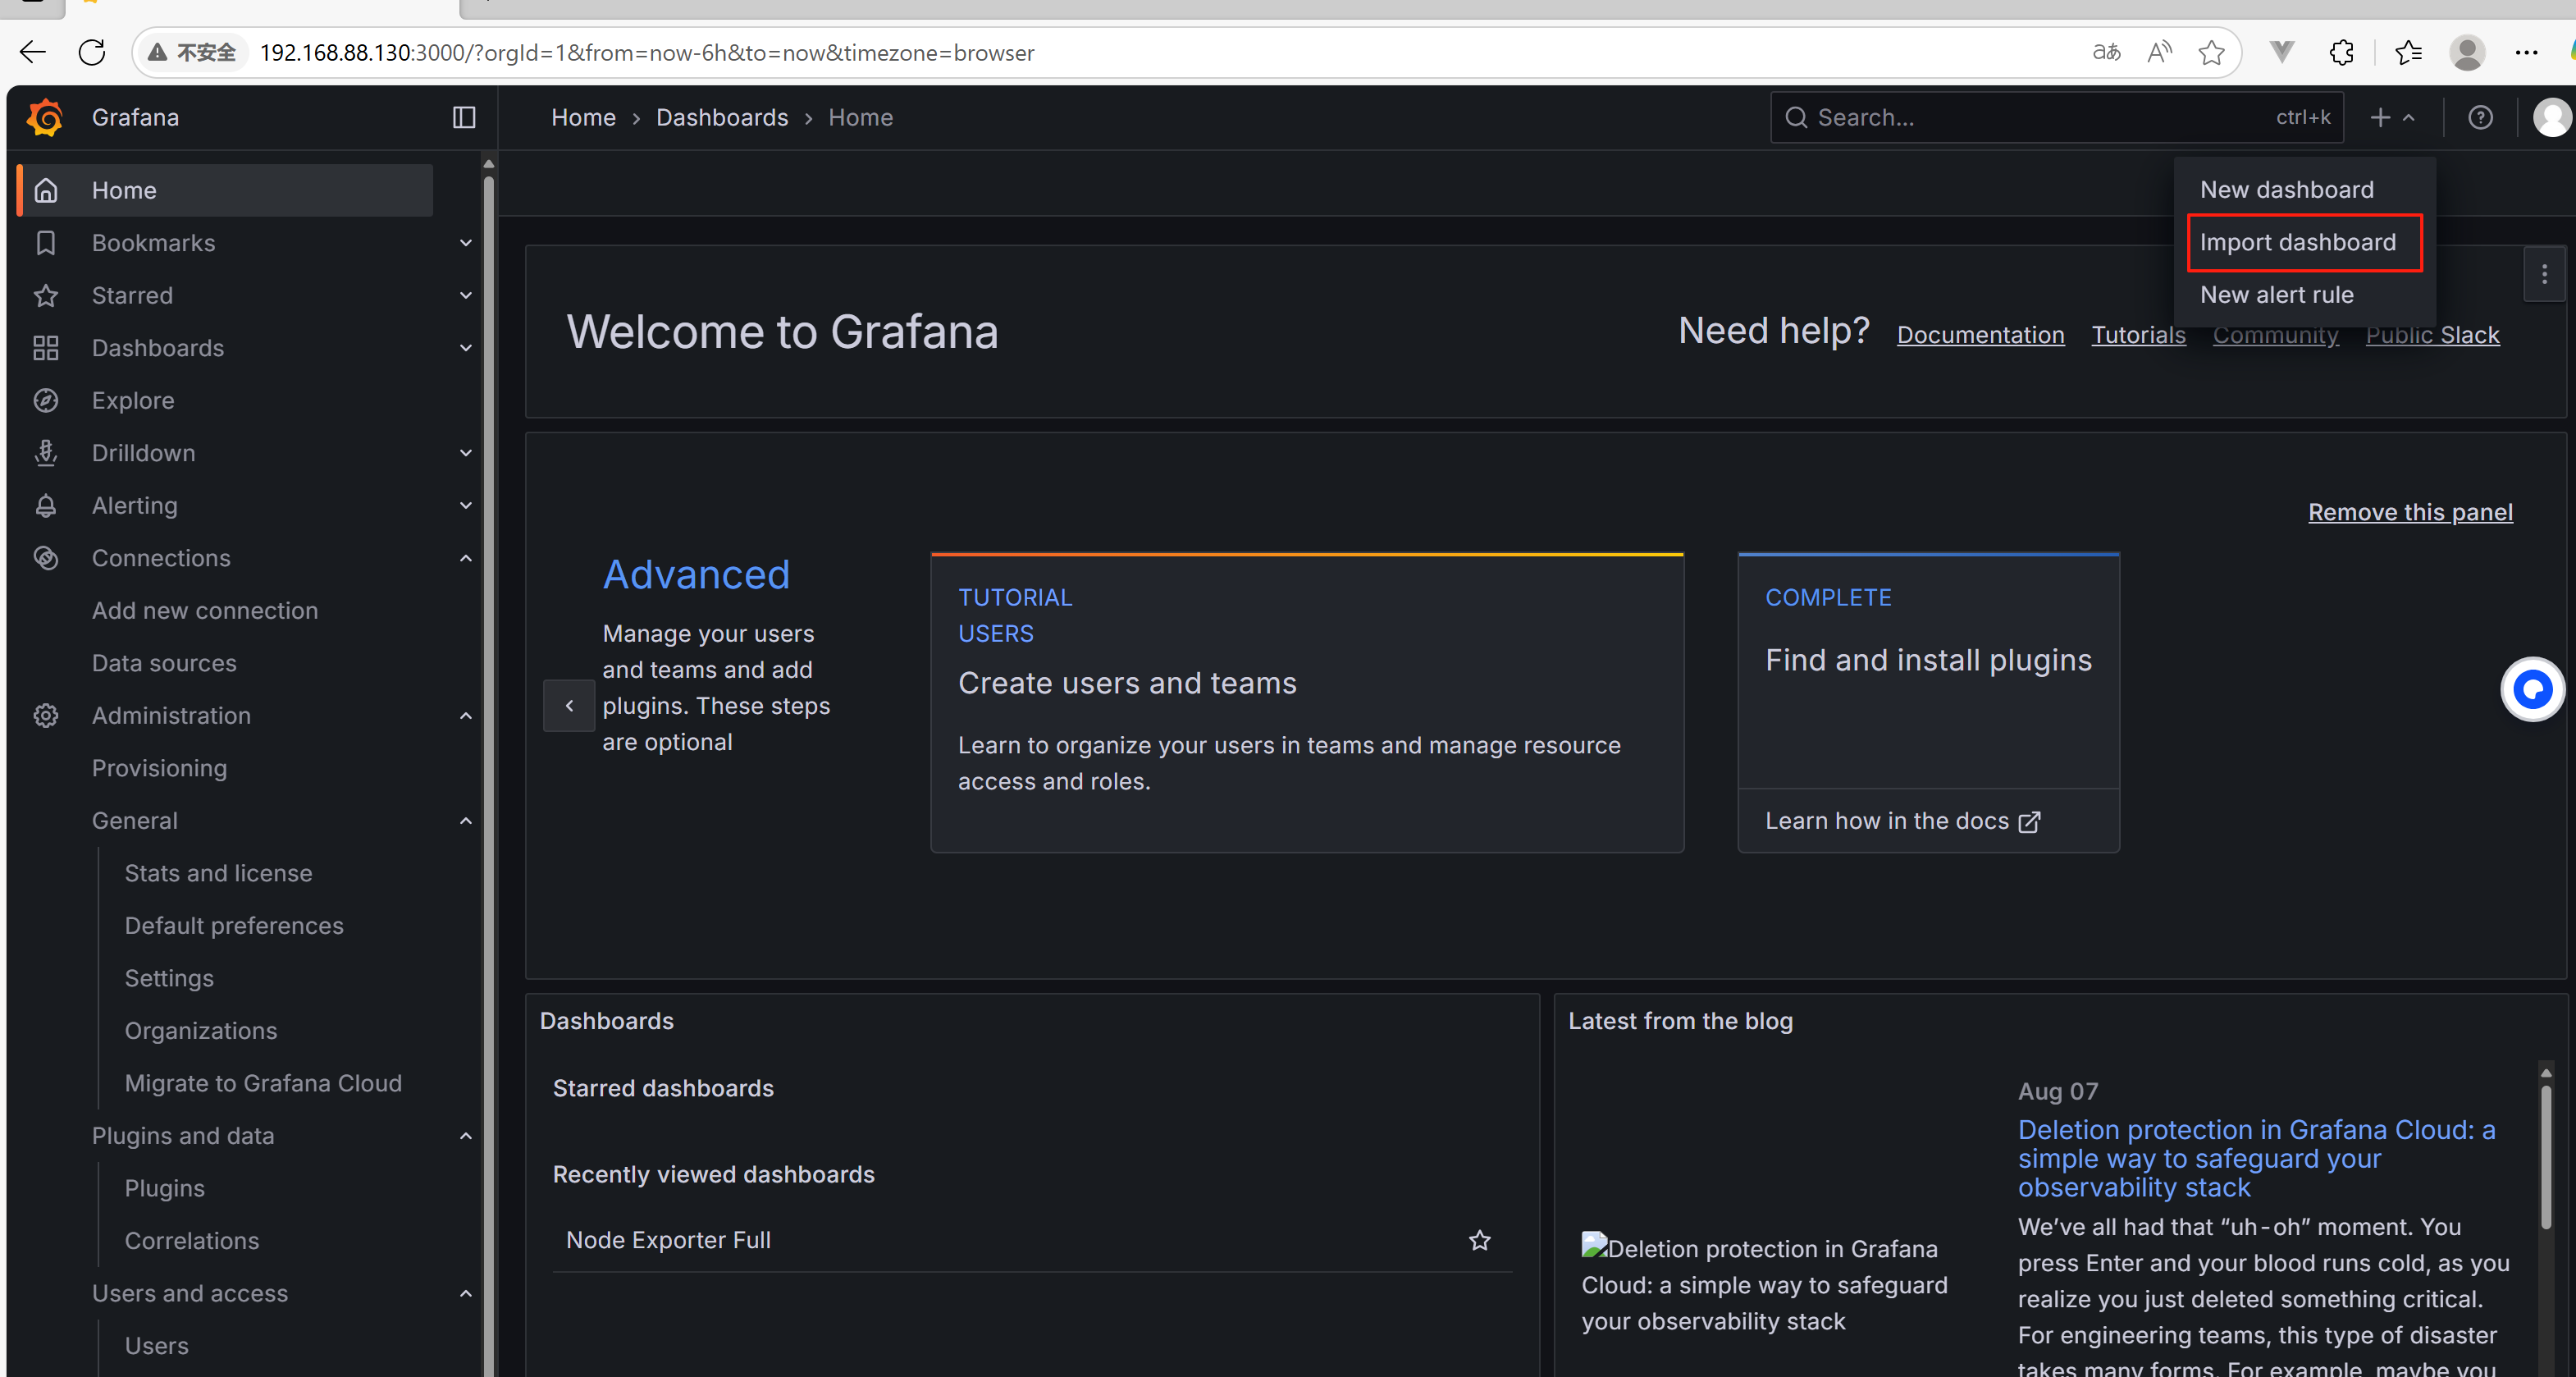
-
在 Import 页面中,输入 dashboard ID:
1860这是官方维护的 Node Exporter 全套模板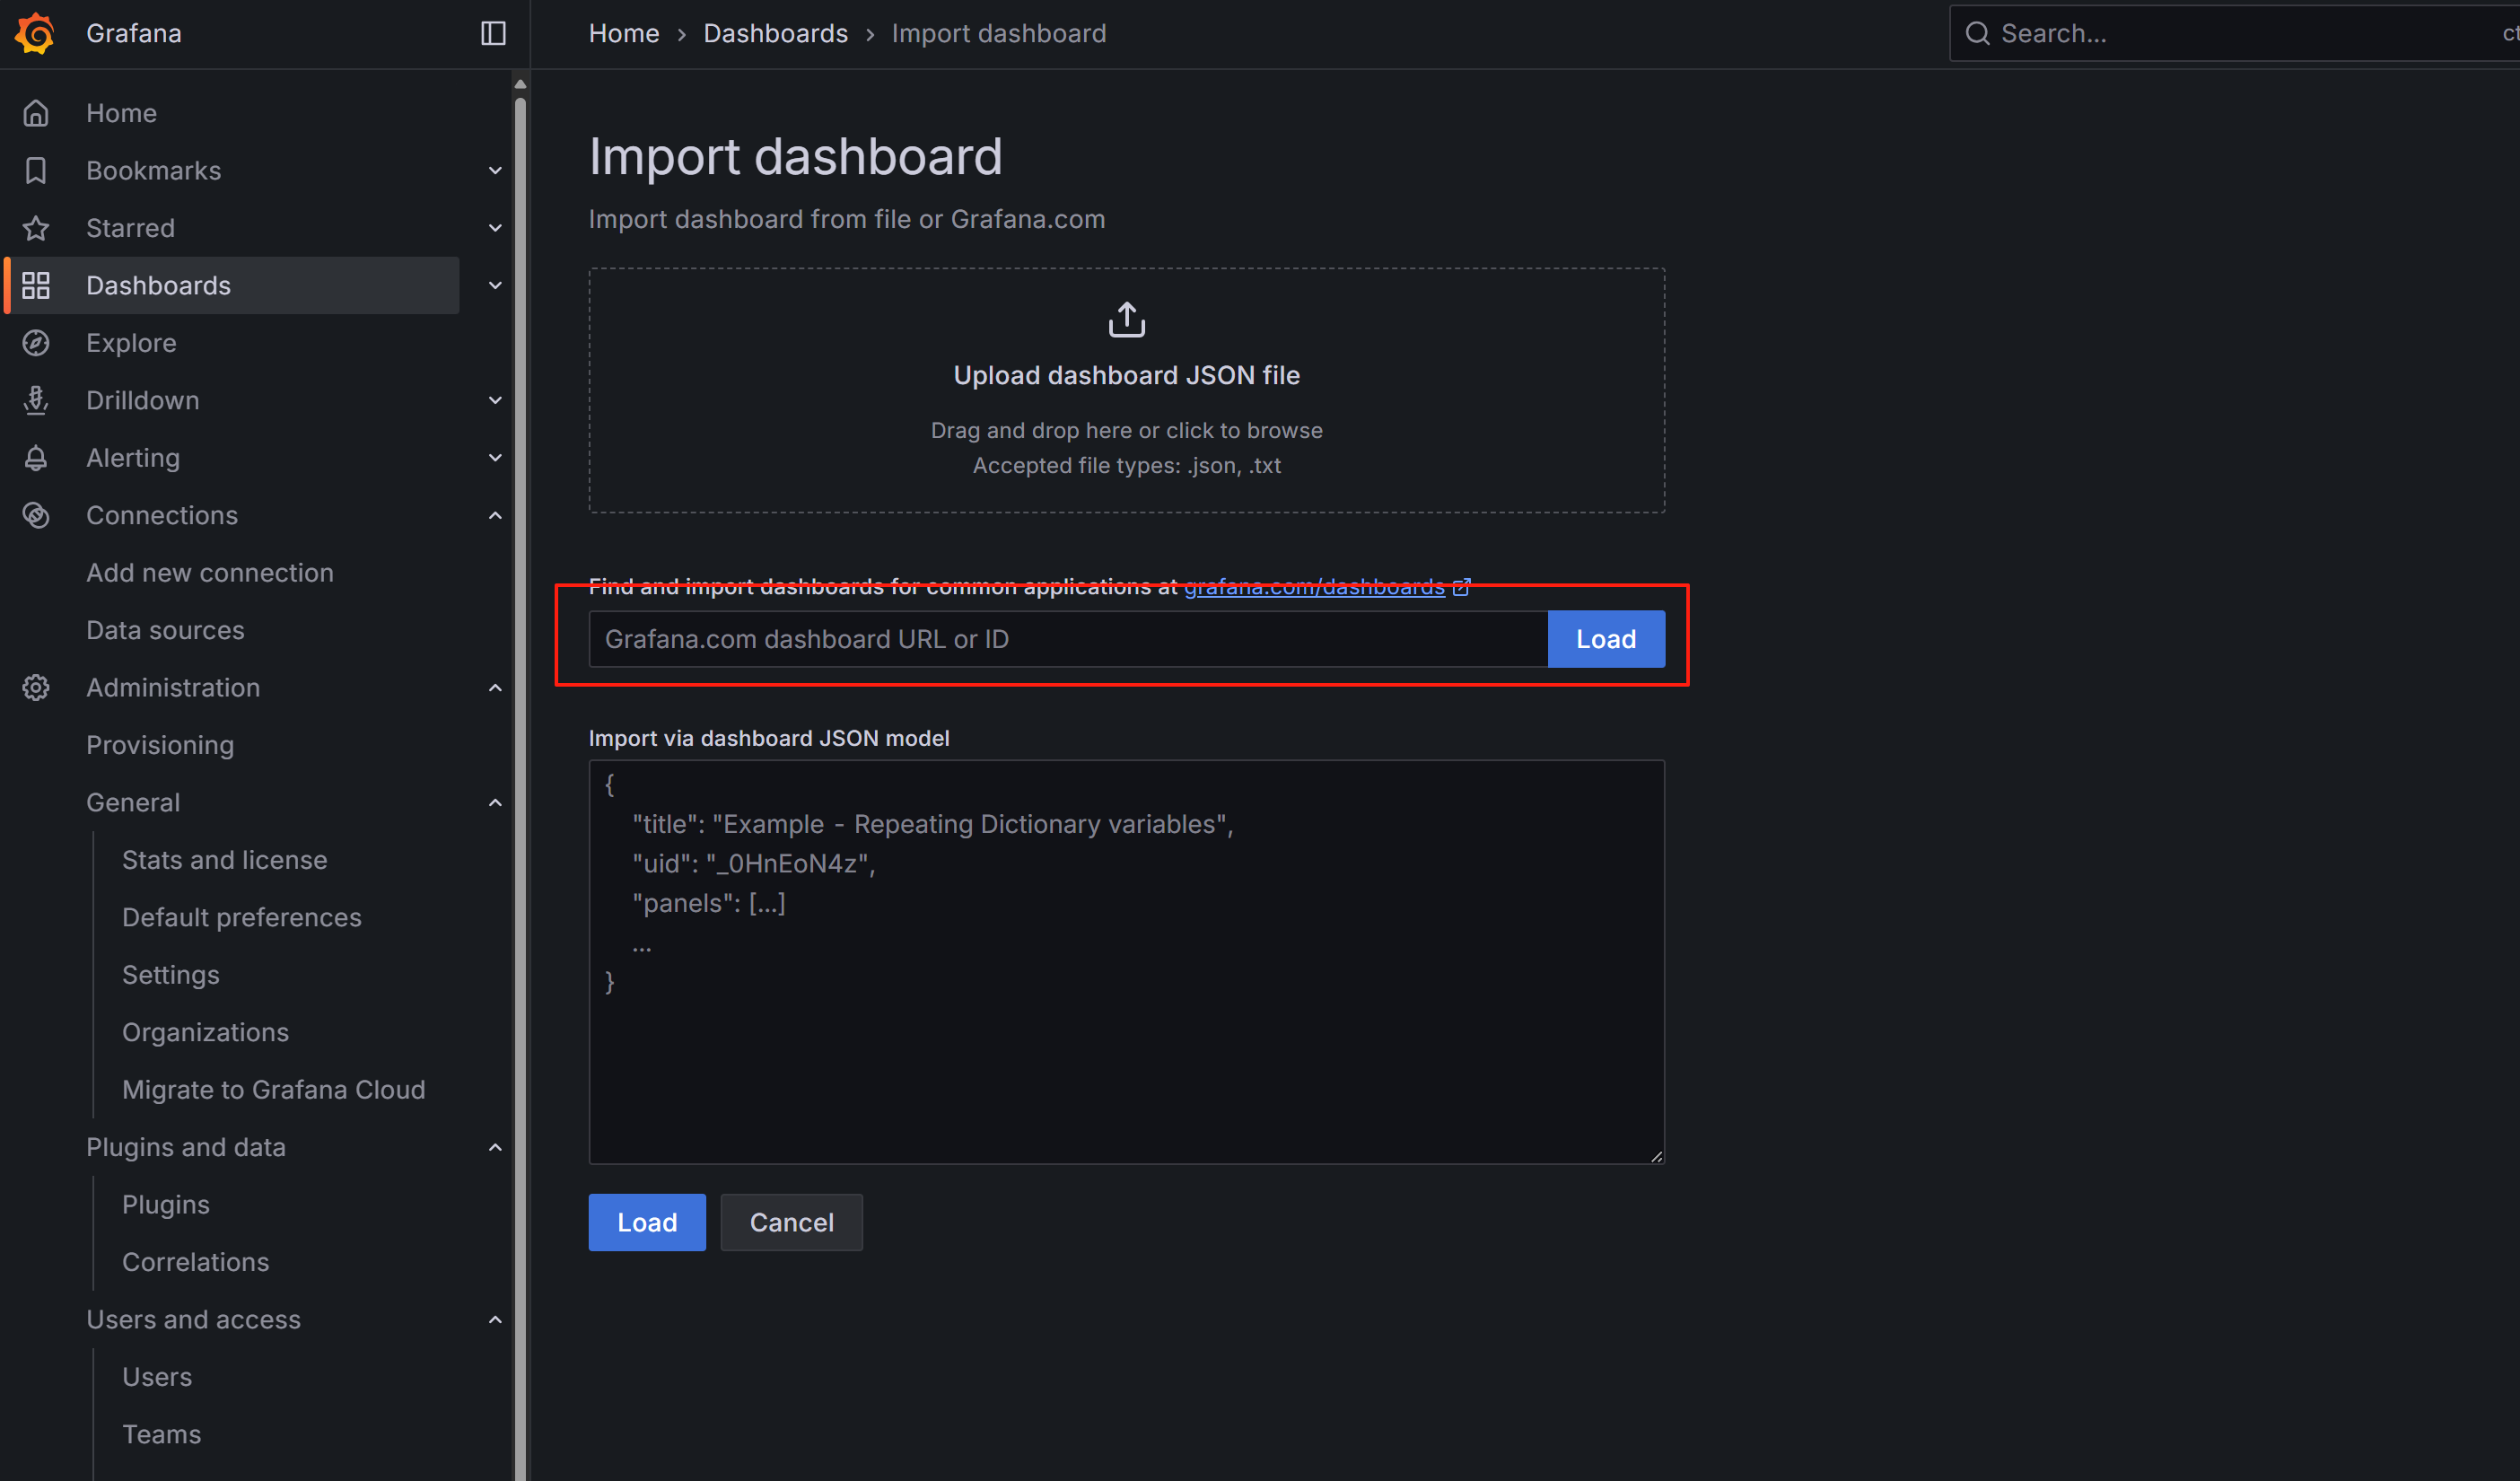
-
点击 Load
-
选择你刚添加的 Prometheus 数据源
-
点击 Import
导入成功后,就能看到完整的服务器资源监控仪表板,包括 CPU、内存、磁盘、网络等信息。
✅ 当前进度回顾
📊 一、导入官方 Node Exporter Dashboard
1. 登录 Grafana
浏览器访问:
http://<你的服务器IP>:3000
默认账号密码是:
用户名:admin 密码:123456
2. 添加 Prometheus 数据源
在 Grafana 页面中:
-
左侧栏点击齿轮「⚙️」 →
Data sources -
点击「Add data source」
-
选择「Prometheus」
-
在 URL 栏填写:
http://localhost:9090 -
点击最下方「Save & test」,如果提示成功则数据源配置完成。
3. 导入 Node Exporter 官方 Dashboard(ID:1860)
-
左侧栏点击「+」 →
Import -
在 “Import via grafana.com” 输入:
1860 -
点击「Load」
-
选择刚才添加的 Prometheus 数据源
-
点击「Import」
你将看到一个完整的、实时更新的系统监控 Dashboard,包括 CPU、内存、磁盘、网络 等指标。
🚨 二、配置告警规则(Prometheus + Alertmanager 简版)
1. 创建 Prometheus 告警规则文件
vim /usr/local/prometheus/rules/alert.rules.yml
示例内容:当 CPU 使用率连续 1 分钟超过 80%,触发告警:
groups:
  - name: node_alerts
    rules:
      - alert: HighCPUUsage
        expr: 100 - (avg by (instance) (rate(node_cpu_seconds_total{mode="idle"}[1m])) * 100) > 80
        for: 1m
        labels:
          severity: warning
        annotations:
          summary: "High CPU usage detected on {{ $labels.instance }}"
          description: "CPU usage is above 80% for more than 1 minute."
2. 修改 Prometheus 配置文件添加告警规则
# prometheus.yml 添加下面配置

rule_files: - "rules/alert.rules.yml"
3. 配置 Alertmanager(可选)
如果你希望支持发送邮件、钉钉、企业微信等告警,可以继续配置 Alertmanager(可等你后面深入时单独学习)。
1. 下载并解压 Alertmanager
cd /usr/local/src/
wget https://github.com/prometheus/alertmanager/releases/download/v0.27.0/alertmanager-0.27.0.linux-amd64.tar.gz
tar -xzf alertmanager-0.27.0.linux-amd64.tar.gz
mv alertmanager-0.27.0.linux-amd64 /usr/local/alertmanager
cd /usr/local/alertmanager
2. 配置 Alertmanager
先备份,在配置
mv ./alertmanager.yml ./alertmanager01.yml
编辑 alertmanager.yml(163邮箱)
global:
  resolve_timeout: 5m
  smtp_smarthost: 'smtp.163.com:465'               # 163 SMTP + SSL端口
  smtp_from: '你的邮箱@163.com'                     # 发件邮箱
  smtp_auth_username: '你的邮箱@163.com'            # 账号
  smtp_auth_password: '你的授权码'                   # 注意:不是登录密码,是客户端授权码
  smtp_require_tls: false                          # 465端口是SSL,不用STARTTLS

route:
  receiver: 'email-alert'
  group_wait: 10s
  group_interval: 1m
  repeat_interval: 3h

receivers:
  - name: 'email-alert'
    email_configs:
      - to: '接收告警的邮箱@example.com'               # 接收方邮箱,可以不是163
        send_resolved: true
💡 说明:
to为告警接收方邮箱
from与auth_username必须一致,且为发送邮箱
auth_password为邮箱 SMTP 授权码(不是邮箱登录密码)
smarthost为邮件服务商的 SMTP 地址(如smtp.qq.com:465)
3. 启动 Alertmanager
#在/usr/local/alertmmanager目录下执行

./alertmanager --config.file=alertmanager01.yml &
默认端口:9093
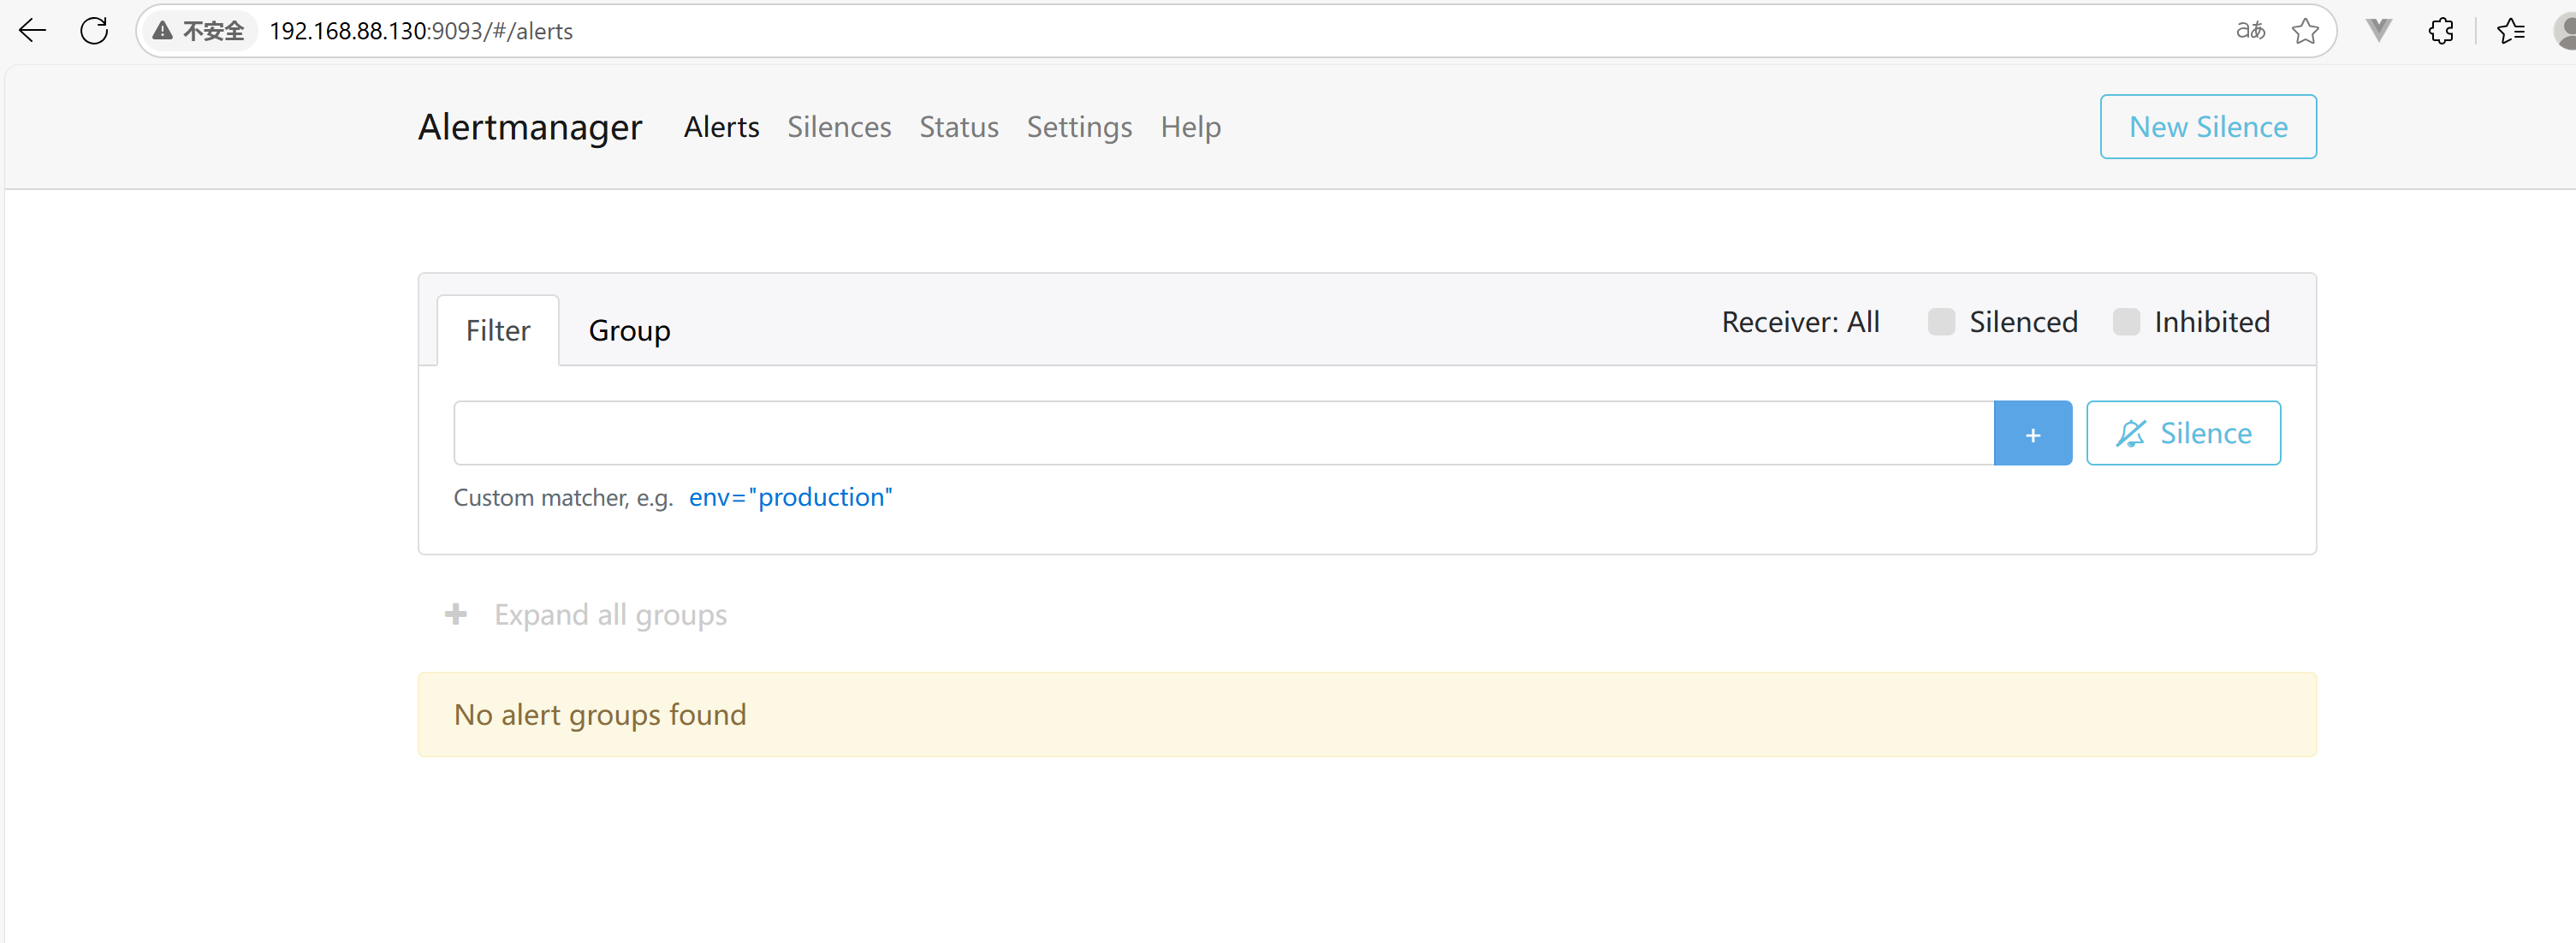
访问测试:http://<你的IP>:9093
4. 将 Alertmanager 接入 Prometheus
修改 Prometheus 配置文件 prometheus01.yml,添加:
alerting:
alertmanagers:
    - static_configs:
        - targets: ['localhost:9093']
5、添加告警规则文件(CPU 使用率 > 90%)
创建 rules.yml
cd /usr/local/Prometheus
vim rules.yml
编写
groups:
  - name: cpu_alert
    rules:
      - alert: HighCPULoad
        expr: 100 - (avg by(instance)(rate(node_cpu_seconds_total{mode="idle"}[2m])) * 100) > 90
        for: 5m
        labels:
          severity: critical
        annotations:
          summary: "CPU 使用率高于 90%"
          description: "实例 {{ $labels.instance }} 的 CPU 使用率已连续 5 分钟超过 90%"
6、在 prometheus.yml 中引入规则文件
rule_files: - "rules.yml"
7️⃣ 重启 Prometheus 和 Alertmanager
pkill prometheus

./prometheus --config.file=prometheus.yml &

pkill alertmanager

./alertmanager --config.file=alertmanager.yml &
8️⃣ 验证告警
-
可以用
stress工具制造高 CPU:yum install epel-release -y yum install stress -y stress --cpu 2 --timeout 600 -
等 5 分钟,看是否收到 163 邮箱的告警邮件
