Monitoring and logging are essential for managing applications in Kubernetes. Without proper visibility into our cluster’s health and performance, troubleshooting issues becomes challenging. This is where Prometheus and Grafana come into play. Prometheus is a powerful monitoring system designed for Kubernetes, while Grafana provides rich visualization capabilities.
In this chapter, we’ll explore how to set up Prometheus and Grafana in Kubernetes, collect metrics, visualize data, and configure alerts to ensure proactive monitoring. By the end, we’ll have a fully functional monitoring system integrated into our Kubernetes environment.
As applications grow in complexity, monitoring helps us −
Prometheus is an open-source monitoring system specifically designed for dynamic cloud environments like Kubernetes. It works by scraping metrics from instrumented applications and storing them in a time-series database. Prometheus provides −
Grafana is a visualization tool that transforms raw metrics into rich dashboards. It connects to Prometheus and provides −
To get started, we will deploy Prometheus and Grafana in our Kubernetes cluster. The easiest way to install them is by using Helm, a package manager for Kubernetes.
Before we begin, we’ll ensure that:
We’ll start by adding the Prometheus Helm Repository −
$ helm repo add prometheus-community
   https://prometheus-community.github.io/helm-charts
Output
"prometheus-community" has been added to your repositories
Update the Helm Repository −
$ helm repo update
Output
Hang tight while we grab the latest from your chart repositories...
...Successfully got an update from the "prometheus-community" chart repository
...Successfully got an update from the "bitnami" chart repository
Update Complete. Happy Helming!
Install Prometheus Stack using Helm −
$ helm install prometheus prometheus-community/kube-prometheus-stack
   --namespace monitoring --create-namespace
Output
NAME: prometheus
LAST DEPLOYED: Mon Mar 10 11:14:18 2025
NAMESPACE: monitoring
STATUS: deployed
REVISION: 1
NOTES:
kube-prometheus-stack has been installed. Check its status by running:
  kubectl --namespace monitoring get pods -l "release=prometheus"
Get Grafana 'admin' user password by running:
  kubectl --namespace monitoring get secrets prometheus-grafana
  -o jsonpath="{.data.admin-password}" | base64 -d ; echo
Access Grafana local instance:
  export POD_NAME=$(kubectl --namespace monitoring get pod -l
  "app.kubernetes.io/name=grafana,app.kubernetes.io/instance=prometheus" -oname)
  kubectl --namespace monitoring port-forward $POD_NAME 3000
This installs Prometheus, Grafana, and Alertmanager under the monitoring namespace.
Verify that Prometheus Pods are Running −
$ kubectl get pods -n monitoring
NAME                                                     READY   STATUS              RESTARTS   AGE
alertmanager-prometheus-kube-prometheus-alertmanager-0   0/2     Init:0/1            0          76s
prometheus-grafana-54d864bf96-t2qjr                      0/3     ContainerCreating   0          3m30s
prometheus-kube-prometheus-operator-dd4b85cc8-qjjmq      1/1     Running             0          3m30s
prometheus-kube-state-metrics-888b7fd55-lv5mq            1/1     Running             0          3m30s
prometheus-prometheus-kube-prometheus-prometheus-0       0/2     Init:0/1            0          76s
prometheus-prometheus-node-exporter-wvgxw                1/1     Running             0          3m30s
This confirms that some of the required services are running, while others are still initializing.
To access this UI, we’ll first port-forward the Prometheus pod −
$ kubectl port-forward prometheus-prometheus-kube-prometheus-prometheus-0 9090 -n monitoring
Output
Forwarding from 127.0.0.1:9090 -> 9090
Forwarding from [::1]:9090 -> 9090
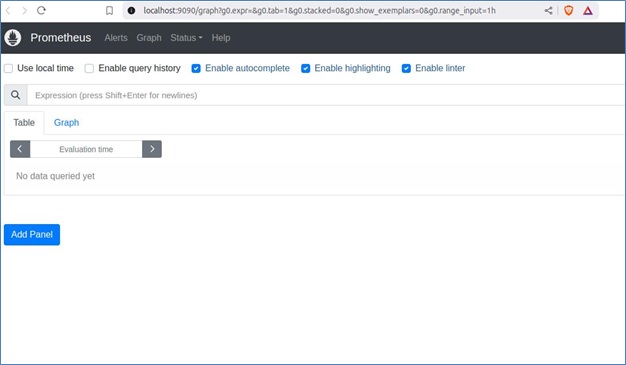
Now, we can visit http://localhost:9090 in our browser to access the Prometheus UI.
Well first port-forward the Grafana pod with the following command −
$ kubectl port-forward prometheus-grafana-54d864bf96-t2qjr 3000 -n monitoring
Output
Forwarding from 127.0.0.1:3000 -> 3000
Forwarding from [::1]:3000 -> 3000
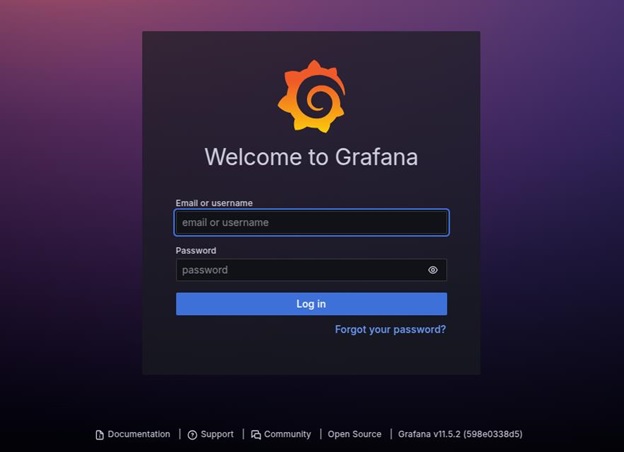
Now, we can open http://localhost:3000 in a web browser and log in using −
Prometheus automatically discovers and scrapes Kubernetes components, including:
To manually expose metrics from an application, we can use an Exporter.
$ helm install node-exporter prometheus-community/prometheus-node-exporter --namespace monitoring
Output
NAME: node-exporter
LAST DEPLOYED: Mon Mar 10 13:42:25 2025
NAMESPACE: monitoring
STATUS: deployed
REVISION: 1
TEST SUITE: None
NOTES:
1. Get the application URL by running these commands:
  export POD_NAME=$(kubectl get pods --namespace monitoring -l
  "app.kubernetes.io/name=prometheus-node-exporter,app.kubernetes.io/instance=node-exporter" -o
  jsonpath="{.items[0].metadata.name}")
  echo "Visit http://127.0.0.1:9100 to use your application"
  kubectl port-forward --namespace monitoring $POD_NAME 9100
Expose Node Exporter on Port 9100:
$ export POD_NAME=$(kubectl get pods --namespace monitoring -l
"app.kubernetes.io/name=prometheus-node-exporter,app.kubernetes.io/instance=node-exporter" -o
jsonpath="{.items[0].metadata.name}")
$ kubectl port-forward --namespace monitoring $POD_NAME 9100
Visit http://127.0.0.1:9100 to see system metrics.
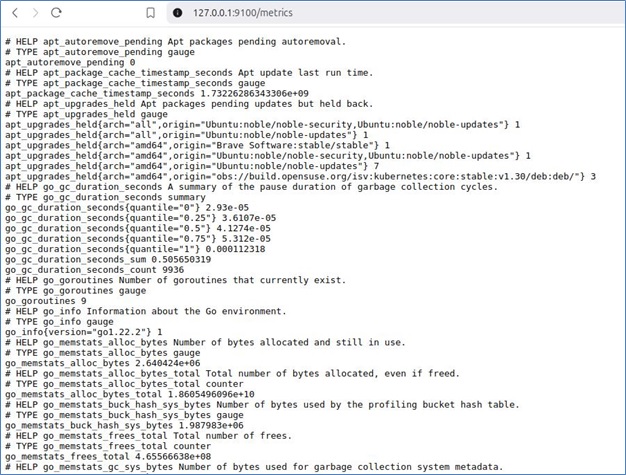
This collects host-level system metrics, including CPU, memory, disk usage, filesystem statistics, and network activity.
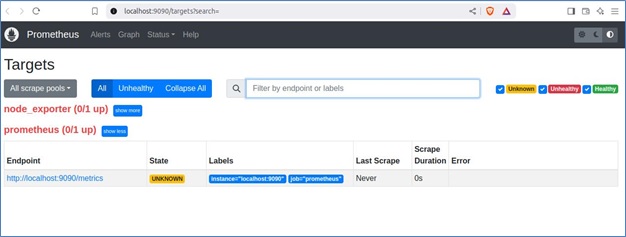
Prometheus collects metrics from various sources, known as targets. These targets can include the Prometheus server itself, Node Exporter, application instances, and other services exposing metrics in a Prometheus-compatible format.
When Prometheus scrapes a target, it assigns one of the following states:
Targets are defined in the Prometheus configuration file (prometheus.yml) under the scrape_configs section.
Here is an example configuration for monitoring both Prometheus itself and Node Exporter:
scrape_configs:
  - job_name: 'prometheus'
    static_configs:
      - targets: ['localhost:9090']
  - job_name: 'node_exporter'
    static_configs:
      - targets: ['localhost:9100']
Each job_name represents a monitored service, and targets specify the endpoints Prometheus scrapes.
Once configured, visit http://localhost:9090/targets to check the status of each target. Clicking on an endpoint will display the raw metrics exposed by the service. These metrics can then be queried in Prometheus and visualized in tools like Grafana for better insights.
Let’s now understand how to visualize metrics with Grafana:
To get started, log in to Grafana by accessing http://localhost:3000 and using the admin credentials.
Next, navigate to the welcome page and go to Data Sources.
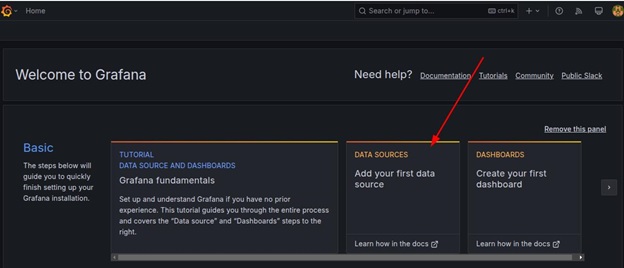
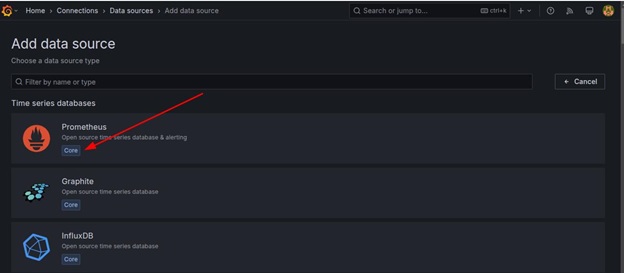
Click Add Data Source and select Prometheus as the data source type.
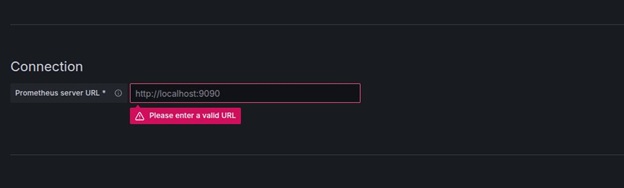
In the URL field, enter http://localhost:9090 as the Prometheus server URL.
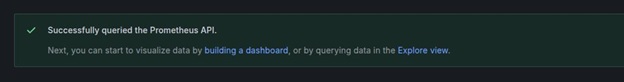
Click Save & Test.
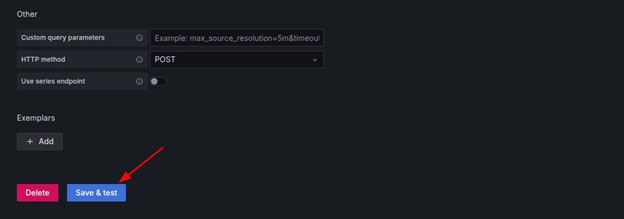
The following output confirms a successful connection:
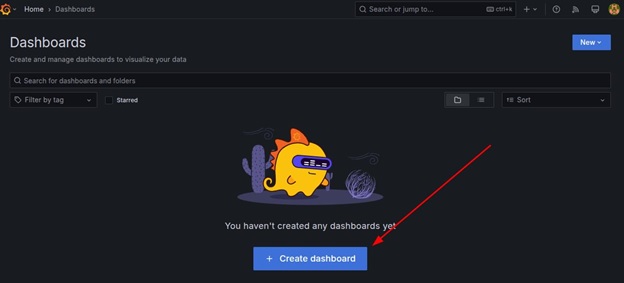
To achieve this, start by clicking Create → Dashboard.
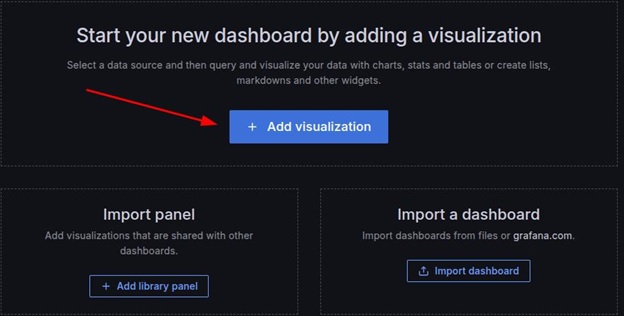
Next, click the Add visualization button.
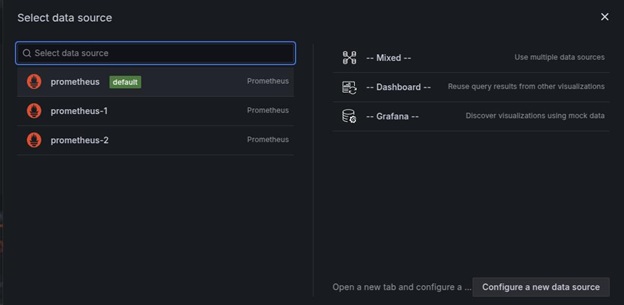
Select prometheus (default) as the data source.
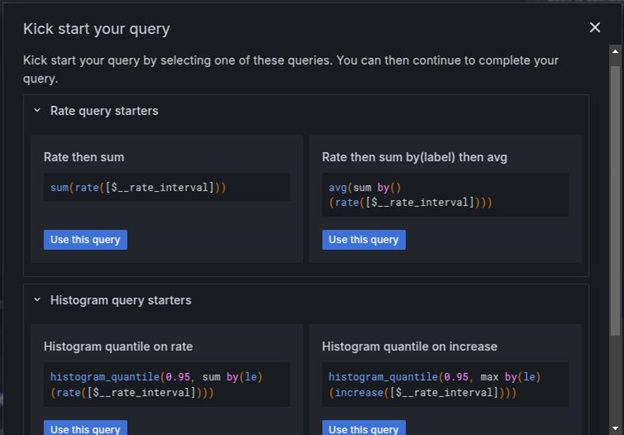
In the Query section, click kick start your query button to choose the query type. Use the Rate then sum as the query.
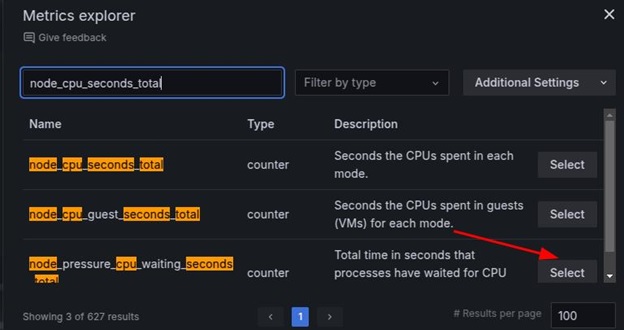
Then, input the query, for instance, node_cpu_seconds_total, and click the relevant option.
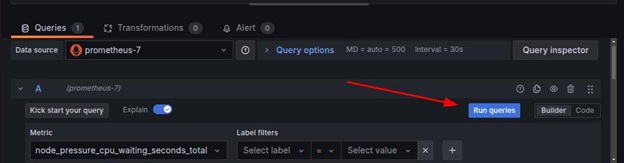
Choose time series as the visualization type (e.g., Graph, Gauge, Table, or Heatmap), and complete the query by clicking run queries.
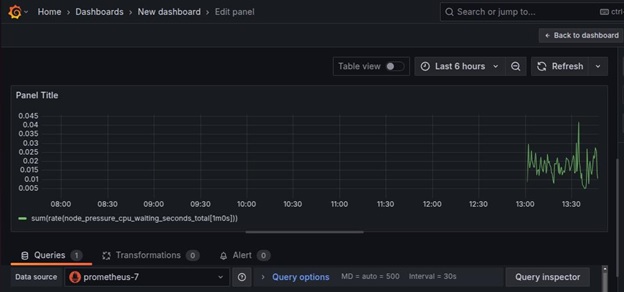
Now, the raw data can be visualized.
Grafana allows importing dashboards using JSON files, which makes it easy to reuse pre-configured visualizations. To import a dashboard, follow these steps:
Obtain a JSON Dashboard File
Download pre-built Kubernetes monitoring dashboards from Grafana’s official website or export an existing dashboard as a JSON file.
Import the JSON File in Grafana
Select Data Source
Choose the correct Prometheus data source to ensure the imported dashboard retrieves the expected metrics.
Import the Dashboard
Click Import to load a detailed Kubernetes monitoring dashboard.
Once imported, customize the dashboard by adding additional panels or adjusting alert thresholds.
To receive alerts when issues occur, we can configure Alertmanager.
Save the following as alerts.yaml.
apiVersion: monitoring.coreos.com/v1
kind: PrometheusRule
metadata:
  name: high-cpu-alert
  namespace: monitoring
spec:
  groups:
    - name: example.rules
      rules:
        - alert: HighCPUUsage
          expr: (100 - (avg by(instance) (rate(node_cpu_seconds_total{mode="idle"}[5m])) * 100)) > 80
          for: 2m
          labels:
            severity: warning
          annotations:
            summary: "High CPU usage detected"
            description: "CPU usage has exceeded 80% for more than 2 minutes"
Apply the rule:
$ kubectl apply -f alerts.yaml
Output
prometheusrule.monitoring.coreos.com/high-cpu-alert created
This confirms that Prometheus has successfully added the alert rule.
Let’s now understand how to manage alerts in Grafana:
Edit the Prometheus Alert Rules:
groups:
  - name: instance-down
    rules:
      - alert: InstanceDown
        expr: up == 0
        for: 5m
        labels:
          severity: critical
        annotations:
          summary: "Instance {{ $labels.instance }} is down"
Apply the alert configuration:
$ kubectl apply -f prometheus-rules.yaml
Output
prometheusrule.monitoring.coreos.com/instance-down created
Open Grafana:
Define a New Alert Rule:
Test and Activate the Alert:
Alert status changes from Pending → Firing when conditions are met. In addition, notifications are sent to the configured contact points when an alert triggers. This ensures that both Prometheus and Grafana provide efficient alerting mechanisms for monitoring Kubernetes infrastructure.
We have highlighted here some of the common issues faced in monitoring and how to troubleshoot such issues.
Listed below are some of the best practices for monitoring in Kubernetes:
Monitoring and logging are crucial for maintaining a healthy Kubernetes environment. Prometheus and Grafana provide powerful capabilities for collecting, analyzing, and visualizing metrics. By setting up Prometheus for metric collection and Grafana for visualization, we gain deep insights into our cluster’s health, helping us detect and resolve issues efficiently.
By implementing these tools, we ensure that our Kubernetes workloads run smoothly and any potential issues are addressed before they impact users.
